Business Simulation Archives

MikesBikes Advanced Splashscreen

MikesBikes Advanced Updates: June 2018

The following MikesBikes Advanced updates will apply to new courses starting from 1 July 2018.

1. Encouraging prudent product strategy

The current scenario enables students to develop as many new product development projects as they wish in a given year. Over time we have observed this can encourage some to undertake a very risky strategy where they rush to enter all new market segments in the first year of the simulation. Those who adopt this strategy often underestimate the significant expenditure required and put their company at a high risk of insolvency.

Our belief is that an “all or nothing” approach to start the simulation should be discouraged. Rather, our team feel it would best to encourage more prudent and realistic product strategies by limiting the number of product development projects to two per year. This means students can still have a product in every market if they wish, but by drawing this out over the first three/four years of the simulation it encourages a more strategic start to the simulation. However, if this update conflicts with how you would like to use the simulation we can disable this on request.

2. Limiting total number of products

Currently the scenario does not limit the total number of products in a company’s product range. We believe it is reasonable to limit the total number of products to five (in the Multi-Player). This encourages students to focus their efforts on fewer successful products, while at the same time creating greater opportunity for mid/low performing companies to improve. This number is still sufficient for students to have a product in every market if they wish. However, if you would like to increase the limit we can do this on request.

3. Final double rollover

Unless we have arranged with you otherwise, all MikesBikes Advanced courses we will now have a double final rollover (meaning the simulation will rollover twice simultaneously). This eliminates the possibility of “end game” decisions, aimed at a single year performance boost at the cost of long-term success. A final double rollover ensures student’s final decisions leave their company in a healthy position.

If you are interested in learning more see: What is a Double Rollover in MikesBikes Advanced and How Does It Work?

Just let us know if you do not want a final double rollover for any reason.

If you have any comments or questions please contact us.

Historical MikesBikes Dogs

The MikesBikes Dog has now Retired

We are currently in the process of updating the simulation interface and as part of this process, the MikesBikes Dog will be replaced with a new way of giving students a quick indication of their firm’s health.  As they say, some good things need to end for better things to begin.

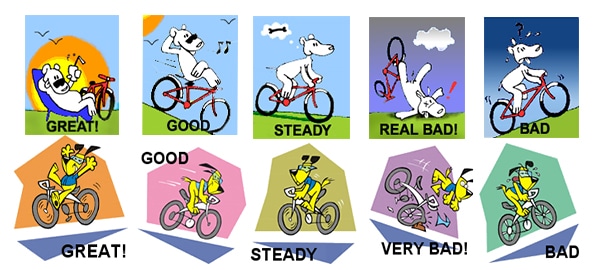
As we bid farewell to the MikesBikes Dog, let’s look back and see how it was brought to life.

“Cliks”

In 1997-98,  we were introduced to Cliks, the MikesBikes Advanced Dog.

The ‘smiley’ artwork in the original 1997 MikesBikes CD release was more of a simple Japanese cartoon style created by one of our programmers, James Saito.

Screenshot from the original 1997 release.

Around the same year, Dr. Pete Mazany, the founder of Smartsims hired Robert Chan as the graphic artist. 

Robert then created the MikesBikes dogs as Pete Mazany loved dogs and always had at least a couple around the office.


We wanted a quick feedback indicator so students would immediately know how they were doing after a rollover, and the dog image was very well received.  Students wanted to see what else the dog would do and it really helped with student engagement.  It actually helps that the original style of the dog is fairly generic, but still endearing.  Some people thought he was a bear, others though he was a goat.  The success of the image is really in his facial expressions and the simple situations he is posed in.

“Einstein”

“Einstein the Dog” arrived soon after launch of MikesBikes Intro.

Nara Paz created Einstein the Dog as a ‘fresher’ re-imagining of the dog concept in 2006, and we integrated these  into MikesBikes Intro soon after.


Although the MikesBikes Dog will be replaced, we will still retain its best elements: giving a quick indication of how the students are doing and providing them with something to look forward to seeing after every rollover.

MikesBikes Intro Hall of Famer, Joe Powell

Interview with the Top Hall of Fame Student: Joe Powell

Joe Powell from Des Moines Area Community College (DMACC) managed to land the #1 spot in the MikesBikes Introduction Hall of Fame!

Joe took the Introduction to Business course taught by Professor Josh Daines over at DMACC. He’s a 41 year old student and a father of 4 returning for a degree in Business Administration. He just graduated a degree in General Studies and got to share the experience of receiving his diploma alongside his wife and daughter in the same ceremony (see photo above). He is now currently working on his second degree.

He never won anything, except for an English contest when he was in 4th grade and a Renaissance Festival tickets last year, but now he managed to successfully land the Top position in the MikesBikes Intro Hall of Fame. This is such an incredible achievement!

We have interviewed Joe to learn about his journey on how he managed to achieve the top spot in the Hall of Fame, his experience and advice to future students.

Smartsims: What is your decision making process within the simulation?

Joe: This is actually the toughest question, I think, that you could ask. My decision making process started out simple, but as the rollovers continued, other factors began influencing my decisions. The first couple rollovers were straightforward: based on the advertising arc, which investments paid off the best? Then the additional product lines, how would the competition respond, what was the best allocation of funds outside of the advertising arc, etc.

Smartsims: What was your strategy going into the simulation?

Joe: I wanted to jump out to an early advantage, allocating funds where they would make the highest return. I wanted to maintain high revenues, high cash-on-hand, and minimize lost sales. I also figured the other firms would implement similar strategies, so I needed to be flexible yet maintain consistent growth. Once I began doubling my SHV every rollover, I focused more on my firm’s progress projections and less on the competition.

Smartsims: How did you begin implementing that strategy?

Joe: I knew the minimum SHV numbers that I wanted to hit at each rollover. I would run practice sim after practice sim until I found the right combination to get to that number. Once I did, I ran more sims to see if I could improve on it. Sometimes it worked, sometimes I made myself frustrated.

Smartsims: How did you familiarize yourself with the simulation?

Joe: I started by opening it up and trying everything. At the beginning of the semester, I did single-player simulations and failed spectacularly. I learned a little here and there, and with the help of some professors at DMACC, I was able to get a grasp on the program.

Smartsims: How would you describe the competition?

Joe: The competition was fun, above all else. The other firms made strategy implementation vital because I just didn’t know what they would do. It was a lot more fun with real people playing instead of just a computer with predictable moves.

Smartsims: What resources did you pull on to develop your winning strategy which led you to be a part of the MikesBikes Introduction Hall of Fame?

Joe: I utilized the Single-Player format first. After about a dozen practices, I had a solid opening strategy. I also talked to MikesBikes guru, DMACC’s own Professor Zarr as well as my Business teacher, Professor Daines, and asked a few questions. Without pointers from them, I wouldn’t have reached the numbers I did. I studied the interviews of previous winners, played around with different strategies, even ran rollovers where all I did was change a few dollars here or there to learn where the benchmarks were. I created my own spreadsheet that helped keep track of money allocations, allowing me to look back on what worked and what didn’t.

Smartsims: What challenges did you face? How did you overcome these?

Joe: At first, my numbers were right where I wanted them. Then, I started getting lost sales and I couldn’t figure out why. My numbers were exactly where I wanted them, and the results should have been predictable. I turned to the offline mode, and it was a life-saver. I strongly suggest anyone in multi-player competitions use the offline mode. It will not predict your opponents’ moves, but it will help you figure out your own.

Smartsims: Was there anything in particular you did that you think helped to prepare yourself?

Joe: I obsessed over this simulation. It wasn’t healthy. I talked about it, I played it, I thought of new strategies while walking around Disney World. My kids rolled their eyes when I would bring it up.

Smartsims: How has participating within a course which uses a business simulation to supplement their teaching materials helped you? What do you think of the business simulation?

Joe: I really liked the sim as part of the curriculum. I mentioned that to the professor during the class review. Learning about the Advertising Mix as well as the Promotion Mix helped understand the importance of allocating funds to specific areas within the sim. Studying it, then putting it into direct action was really a cool experience. I really enjoyed having Mike’s Bikes as part of the class.

Buy and sell capacity in MikesBikes

Buying and Selling Plant Capacity in MikesBikes Advanced

Buying Plant Capacity

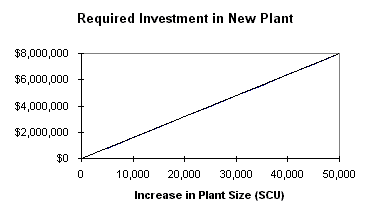
Plant can be purchased or sold each period in multiples of 10 SCUs. Each 10 SCU of plant costs $1,600 to buy and any new plant takes one period to be commissioned and become productive.

Selling Plant Capacity

Plant is depreciated in the annual accounts using the diminishing value method, at a rate of 20% per annum. It can also be sold at any time. However the selling price will depend upon the age of the plant, how well it has been maintained, and how much investment has been made into quality systems and setup time reduction upgrades.

If there is any difference between the actual selling price of plant and its book value then that will be reported in the accounts as either a loss or gain on sale. When plant is sold, you lose the use of that plant immediately.

Best Practice in Experiential Learning by Frank Voehl

While all industries have best practices, they are especially prevalent in IT given that so much of the business revolves around data and business processes. Best practices formally represent tested and proven techniques in the form of procedural documentation. In contrast, undocumented procedures are often misleading because stated parameters are not necessarily true or accurate.

Best Practice

Definition – What does Best Practice mean? 

A best practice is an industry-wide agreement that standardizes the most efficient way to accomplish a desired outcome. A best practice generally consists of a technique, method or process. The concept implies that if an organization follows best practices, a delivered outcome with minimal problems or complications will be ensured. Best practices are often used for benchmarking and represent an outcome of repeated and contextual user actions.

Abstract

Experiential learning is the basic process of learning through experience and is more specifically defined as learning through reflection on doing. It is akin to forms of Hands-on Learning but does not necessarily involve participants reflecting on the outcomes or products of the process. Experiential learning is distinct from traditional forms of rote or didactic learning, in which the learner plays a comparatively passive role. It is related to, but not synonymous with, other forms of action learning and free-choice learning, along with cooperative learning.[1]

Assessing the effectiveness of the training program in terms of the benefits to the trainees and the company is a crucial element of any experiential learning program. Most assessments are data driven, and traditional tools use tests to measure effectiveness. When it comes to experiential learning programs, it is extremely difficult to gather data that can be used for assessments. This is where analytics come in. When combined with simulations and gamification, experiential training products become a powerhouse of data that can be used to deliver assessments results accurately across cognitive learning, skills affect and objective results.

The analytics engines in these simulations (such as MikesBikes) record, analyze and provide a detailed report on the participants’ interaction throughout the simulation. For writing purposes, I have chosen to use the classic Journalism tool called the 5Ws and One H method, starting with What, followed by Why, When, Where, Who — and lastly — How.[2]

What is Experiential Learning

In the words of Lewis and Williams: “In its simplest form, experiential learning means learning from experience or learning by doing. Experiential education first immerses learners in an experience and then encourages reflection about the experience to develop new skills, new attitudes, or new ways of thinking.”[3] The first theories of experiential learning arose in the mid-nineteenth century as attempts to move away from traditional formal education, where teachers simply presented students with abstract concepts, and toward an immersive method of instruction. Students would “learn by doing,” applying knowledge to experience to develop skills or new ways of thinking.

Experiential learning is also built upon a foundation of interdisciplinary and constructivist learning. Experiential methodology doesn’t treat each subject as being walled off in its own room, unconnected to any other subjects. Compartmentalized learning doesn’t reflect the real world, while as the experiential classroom works to create an interdisciplinary learning experience that mimics real world learning.

Similarly, experiential learning is aligned with the constructivist theory of learning in that the outcomes of the learning process are varied and often unpredictable and learners play a critical role in assessing their own learning.  How one participant chooses to solve a problem will be different from another, and what one takes away from an experience will be different from the others.

The context for learning is different—learning may not take place in the classroom, and there may be no textbooks or academic texts to study. Finally, the curriculum itself may not be clearly identified—the student may have to identify the knowledge required and then acquire it themselves, reflecting on their learning as they go along.

Experiential learning can also be defined by the qualities it imparts on its learners. Successful experiential learners have a willingness to reorder or alter their conception of a topic. They can reason for themselves and are able to successfully explain their position. They have clarity of purpose with tasks they undertake and the self-management skills necessary to work successfully both alone and in a group.

Experiential learners are aware of the “rules” governing their discipline or mode of operation, but are also open-minded, and able to work with people with different views. Finally, experiential learners are in control of their voice—they can identify the role of emotion in their learning, as well as reflect on how they have come to their new knowledge (Moon, 2004, p. 163).[4]

Why Use Experiential Learning

The open nature of experiential learning means that it can often be difficult to define what is, and is not, an experiential activity. There are many activities that have the potential to be experiential but may not be depending on the execution.

As outlined by Chapman, McPhee, and Proudman:

“Simple participation in a prescribed set of learning experiences does not make something experiential. The experiential methodology is not linear, cyclical, or even patterned. It is a series of working principles, all of which are equally important or must be present to varying degrees at some time during experiential learning. These principles are required no matter what activity the student is engaged in or where the learning takes place” (1995, p. 243).[5]

To define ‘why,’ the following list of characteristics can be used to define the purpose of an activity or method as experiential, including [6]:

  1. Mixture of content and process: There must be a balance between the experiential activities and the underlying content or theory.
  2. Absence of excessive judgment: The instructor must create a safe space for students to work through their own process of self-discovery.
  3. Engagement in purposeful endeavors: In experiential learning, the learner is the self-teacher, therefore there must be “meaning for the student in the learning.”
  4. Relevance: The learning activities must be personally relevant to the student. Prepared by Michelle Schwartz, Research Associate, for the Vice Provost, Academic, Ryerson University, 2012
  5. Encouraging the big picture perspective: Experiential activities must allow the students to make connections between the learning they are doing and the world. Activities should build in students the ability to perceive and understand the relationships in complex systems, and then find a way to work within them.
  6. The role of reflection: Students should be able to reflect on their own learning, bringing “the theory to life” and gaining insight into themselves and their interactions with the world.
  7. Creating an emotional investment: Learners must be fully immersed in the experience, not merely doing what they feel is required of them. The process needs to engage the learner to a point where what is being learned and experienced strikes a critical, central sweet-spot within the learner.
  8. The re-examination of values: By working within a space that has been made safe for self exploration, students can begin to analyze and even alter their own values.
  9. The presence of meaningful relationships: One part of getting students to see their learning in the context of the whole world is to start by showing the relationships between “learner to self, learner to teacher, and learner to learning environment.”
  10. Learning outside one’s perceived comfort zones: “Learning is enhanced when students are given the opportunity to operate outside of their own perceived comfort zones.” This doesn’t refer just to physical environment, but also to the social environment. This could include, for instance, “being accountable for one’s actions and owning the consequences.”
When and Where: Methods for Assessing Experiential Activities

One of the keys to experiential learning is personalized learning. To enable personalized learning, every program needs to enable a journey through the following phases: Assessment, teaching and learning strategy, and curriculum choice. Experiential learning methodology is highly effective in meeting these requirements to enable personalized learning. It is a radical departure from traditional learning methods and takes the learning beyond the classroom, as the participants set their own learning pace. By combining technology and simulations with experiential learning, companies are making this concept available anytime and anywhere, across multiple devices.  This has introduced the concepts of the ‘flipped classroom,’ where the learning goes to the students and not the other way.[7]

Although there are potentially a wide variety of ways to assess when to use experiential activities, the most productive include both external and internal factors. Although all these methods are tied to reflection, the key is helping learners by focusing their learning while also producing an outcome/ product for assessment purposes.

Moon lists 20 or more examples in the Handbook of Reflective and Experiential Learning[8], of which items # 1, 3, 10, 13 and 15 have traditionally been selected as the most effective and popular:

  1. Maintenance of a learning journal or a portfolio
  2. Reflection on critical incidents
  3. Presentation on what has been learnt
  4. Analysis of strengths and weaknesses and related action planning
  5. Essay or report on what has been learnt (preferably with references to excerpts from reflective writing)
  6. Self-awareness tools and exercises (e.g. questionnaires about learning patterns)
  7. A review of a book that relates the work experience to own discipline
  8. Short answer questions of a ‘why’ or ‘explain’ nature
  9. A project that develops ideas further (group or individual)
  10. Self-evaluation of a task performed
  11. An article (e.g. for a newspaper) explaining something in the workplace
  12. Recommendation for improvement of some practice (a sensitive matter)
  13. An interview of the learner as a potential worker in the workplace
  14. A story that involves thinking about experiencing learning
  15. A request that students take a given theory and observe its application in the workplace
  16. An oral exam
  17. Management of an informed discussion
  18. A report on an event in the work situation (ethical issues)
  19. Account of how discipline issues apply to the workplace [9]
  20. An identification of and rationale for projects that could be done in the workplace.
Who Uses Experiential Learning

Instructors and participants like to use experiential learning for simulations. Simulations use real life scenarios that depict several challenges that a participant will eventually face after the course completion. It is only natural that mistakes happen during learning; using simulations is like taking kids to a playground, and getting them to have fun, try new things and learn in a safe controlled environment. By moving beyond theory to the realm of “learning by doing,’ the learner gets a first-hand experience of practicing what has been taught.  This plays a crucial role in retaining concepts and ideas.

How to Use the Learning Portfolio

There are very few learning methods that can have a dramatic impact on the participant’s mindset. Experiential Learning is one of them. Management guru Henry Mintzberg pointed out long ago that leadership, like swimming, cannot be learned by reading about it. The high focus on collaboration and learning from each other benefits the participant as it increases engagement. On the other hand, since the participant is immediately involved in the problem-solving activity or event, the level of ownership of the outcome is high.

Of these methods, Qualters[10] focuses on using the learning portfolio as one of the most comprehensive methods of assessing experiential learning, with its purpose being to “strongly determine the themes of the reflective narrative, as well as the types of documentation or evidence selected in the appendices.” A planning rubric representing this can be a table with three columns—purpose, theme, and evidence—and the content of these columns can be quite broad.  John Zubizarreta[11] proposes a simple model for a learning portfolio with three fundamental and interrelated components:

1. Reflection  2. Documentation  3. Collaboration.

Learning portfolios are distinguished from standard professional portfolios through their inclusion of a reflection component. It therefore becomes more than just “a showcase of student materials,” and instead becomes a “purposefully designed collection connected by carefully thought out structured student reflections.”

To plan a learning portfolio project, Zubizarreta[12] provides a short rubric that asks instructors to first identify the purpose of the portfolio, and then answer the following questions:

  1. What kind of reflective questions should students address?
  2. What kinds of evidence or learning outcomes would be most useful?
  3. How will students engage in collaboration and mentoring during the process?

Beyond assessing student learning, well-constructed portfolios can be used for accreditation, university-wide outcome assessment, and to document and understand the learning process at both the level of course and program.

How to Measure and Assess Experiential Learning

Measurement and assessment are very often the most integral parts of the experiential learning process. It provides a basis for participants and instructors alike to confirm and reflect on the learning and growth that has and is occurring. Further, proper assessment methods engender a “reflective process that ensures continued growth long after specific learning opportunities have been completed.

Without the appropriate assessment tool, such as a self-assessment, the educator might not ever realize that significant learning occurred. Therefore, classroom educators should search for assessment techniques that measure more than just the ability to remember information. [13]. The assessment of experiential activities presents a unique problem to instructors. Because in experiential activities the means are as important as the ends, “it is important to look at assessment as more than outcome measurement.

While outcomes are important to measure, they reflect the product of assessment, not a complete assessment cycle” (Qualters, 2010, p. 56). It is therefore necessary to devise unique assessment methods to measure success in both the process and the product—each area requires separate learning outcomes and criteria (Moon, 2004, p. 155).

Summary

I believe there are eight reasons why experiential learning is very likely to become the future of learning: [14]

  • Accelerates the learning process
  • Provides a relatively safe and secure learning environment
  • Bridges the gap between learning theory and practice
  • Produces demonstrable mindset changes
  • Increases participant engagement levels
  • Delivers exceptional Return on Investment or payback
  • Provides measurable and accurate assessment results
  • Enables personalized learning.

Everybody has one’s own model of learning, some of them more effective than others. In this article, I tried to convince interested readers to become enablers of a powerful learning experience which will help build a learning context by experiencing things. The need is urgent; the time is now.

The question is: Are you ready?


For references and footnotes view the PDF copy here: Best Practices in Experiential Learning by Frank Voehl

Frank Voehl

This article is written by Frank Voehl. Frank is an Innovation Coach and expert in the application of the business improvement tools and innovation methods to public and private organizations, including city, county, community government, and non-profit operations. He is also a Grand Master Black Belt Instructor in Lean Six Sigma and Performance Management. He’s a noted author and series editor of over 30 books and hundreds of business management and improvement articles and technical papers. He also provided input on the original design of the Malcolm Baldrige National Quality Award, and facilitated its crossover to other nations and regions, including the Bahamas, South America, Europe and the Czech Republic.
Awareness Index in MikesBikes

Question of the Week: What does the Awareness Index mean and how do you influence it?

MikesBikes' Market Summary Report

The Awareness Index is the performance of your Advertising and Branding decisions.

To increase it, you should invest in Branding, increase your total Advertising expenditure, and improve your Advertising mix.

Branding

Investing in promoting your firm’s brand will enhance the awareness of all your products. Brand advertising is a valuable complement to your individual product advertising – especially if you have several products.

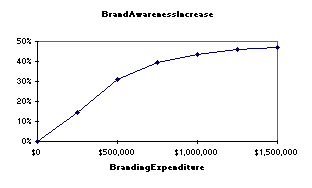
About half of your brand awareness will carry over from the previous period. The curve below shows the increase in brand awareness (on top of what is carried over) achieved by various levels of expenditure.

branding graph

Advertising Mix

Your Advertising mix is how your Advertising budget is allocated across the three media channels (TV, Internet and Magazines). To improve this, you will need to identify which channels your customers view the most (see Market Information report).

Below are steps on how you can develop an effective Advertising Mix.

How to develop an Advertising Mix:

There are three substantial resources that you can use to determine your optimal advertising mix for a given advertising spend. One is through the Advertising and PR Reach by Media curve, the Product Dimension Sensitivities and lastly the Media Viewing Habits table. All of these can be found within the Market Information Report.

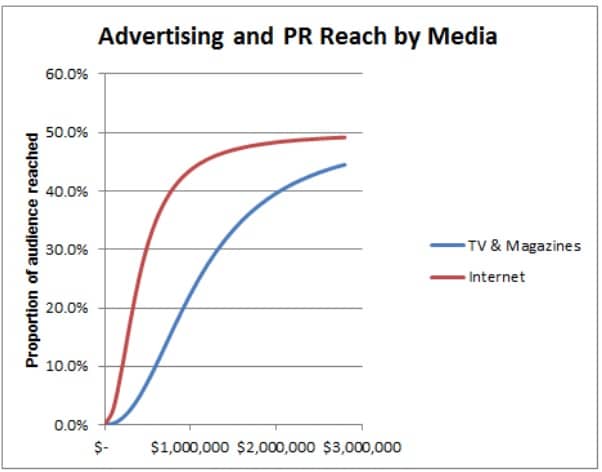
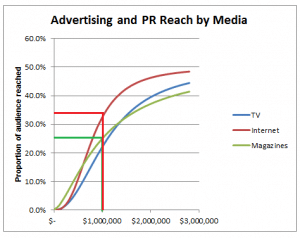
Each media type can reach a given proportion of its audience for a given investment. This is shown within the Advertising and PR Reach by Media graph below.

Advertising and PR Reach Curve

As an example, let’s say we are developing an Advertising Mix for the Adventurer segment with a budget of $2 million.

Step 1: Identify the segment’s sensitivities

If we look at the Market Information Report, we will see in the Product Dimension Sensitivities that the Adventurers segment has Medium sensitivity in Advertising.

What these sensitivities mean is that a change in any of these factors will result in a proportionate change in the consumers’ demand for the product.

Product Dimension sensitivity information in MikesBikes

Step 2: Identify the segment’s Media Viewing Habits

You will need to consider your consumers’ viewing habits by referring to the Media Viewing Habits chart (below) to help you allocate your budget on each channel.

Media Viewing Habits

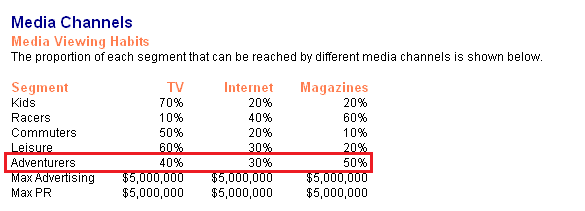
The table shows us that 40% of the Adventurers market watch TV, 30% engage within the use of the Internet regularly, and 50% read magazines and is the most prevalent media channel. You then use this information with the reach curves to calculate the percentage of the market segment you’re actually reaching.

Step 3: It’s now time to allocate our Advertising Budget!

We know that we have $2 million to spend on Advertising this Adventurer product directly. We know that 50% of this segment view magazines and 40% watch TV, but 30% are on the internet regularly. Also, while Adventurers segment mostly read magazines; the internet has a higher reach so we will look into investing in Internet and Magazines.

Advertising and PR Reach Curve. Allocated spend on Internet

If we spend $1 million on Internet, we will reach around 44% of the Internet Viewers. 30% of the Adventurer segment can be reached via Internet advertising, meaning we could reach approximately 30% x 44% = 13.2% of the Adventurer segment.

If we spend $1 million on Magazines, we will reach around 22% of the Magazine readers. 50% of the Adventurer segment can be reached via Magazine advertising, meaning we could reach approximately 22% x 50% = 10% of the Adventurer segment.

Together, our $2 million budget (half spent on Internet and half on Magazine) would reach approximately 23% of the Adventurer segment.

This is only an example. This is far from the best mix you can make. We suggest playing around on different Marketing Mixes and see what works best for your strategy and budget.

Have a Question of the Week suggestion? Send this to us here or message us on Facebook.

Stack of money.

External Funding Options in MikesBikes: Debt or Equity?

In MikesBikes, funding large investment options such as purchasing additional plant capacity and development projects may require additional capital. Raising Debt or Equity are ways companies can raise additional funds to finance these large projects or investments. In deciding whether to increase Debt, issue Shares or a combination of both; companies should assess their current situation and the impact of each financial decision. Continue reading External Funding Options in MikesBikes: Debt or Equity?

Why is Shareholder Value the Main Metric in MikesBikes?

Here are some reasons why Shareholder Value is the main metric in MikesBikes:

There are arguments for and against any metric you might choose.  However, if there is a single metric on which students are measured, Shareholder Value is better for grading in most courses. This metric is simple to understand, capture and reward both financial and operational performance, and provide reasonable consistency of grading across courses.

What about alternative metrics?

Share Price

The Share Price valuation model incorporates a number of factors such as:

  • Earnings per Share (smoothed over time to reduce the effect of one-off good/bad performances)
  • Adjustments for certain types of spending which potentially add future value to your company, such as investment in product development, etc.
    • This is important so that firms who only make small profit or loss due to heavy investment in R&D or building product awareness are not punished.
  • Risk – In general, the higher the Debt/Equity ratio of the company, the higher the risk and the lower the Share Price.
  • Since it is based on Earnings per Share, in general, if you issue many shares, your Share Price will suffer. On the other hand, if you repurchase shares, your Share Price will improve.

Share Price hits most of our goals for a grading metric. However, Shareholder Value is a logical choice over Share Price because Shareholder Value is the current Share Price plus the present value of all past dividends paid. It is the value to an investor over time of having owned a single share of the company since the beginning of the simulation.

Market Share

Market Share by itself isn’t a particularly useful metric – your competitors could have a lower market share and be significantly more profitable.

Growth in profitability does not take into account how you financed your growth. Did you have to issue a large number of shares to fund your growth, which dilutes the value to an investor? Did the company heavily leverage itself increasing risk? What is Profitability? Do you look at total periods made in a given time period? Do you weigh more recent profits more heavily? What about the time value of those profits? How would you provide an understandable metric for that?

Total Market Capitalization

If you use total market capitalization, then you are inviting students to issue large amounts of additional equity to grow that figure. This is unlikely to benefit the performance of a successful company in any significant way as they do not require the extra funding.

Therefore, it is difficult to choose another single metric that captures the financial and operational performance of the company as well as Shareholder Value does.

On a side note, you could construct a Balanced Scorecard type metric where you look at various factors from different parts of the organization. In general, you still need to combine those somehow into a score which can be ranked and graded (and Shareholder Value would probably still form part of such a system). You will end up with a similar effect to ranking by Shareholder Value, but your metric no longer corresponds directly to a business concept, and you have to decide how your score should work. Is it an arbitrary number of ‘points’? Is it a percentage? An arbitrary metric may be harder to understand and explain than Shareholder Value. However, this is probably how we would look at grading. If at some time in the future we ever decide that Shareholder Value does not sufficiently capture performance across the entire business.

economic value created

What is Economic Value Created (EVA)?

financial results for all firms

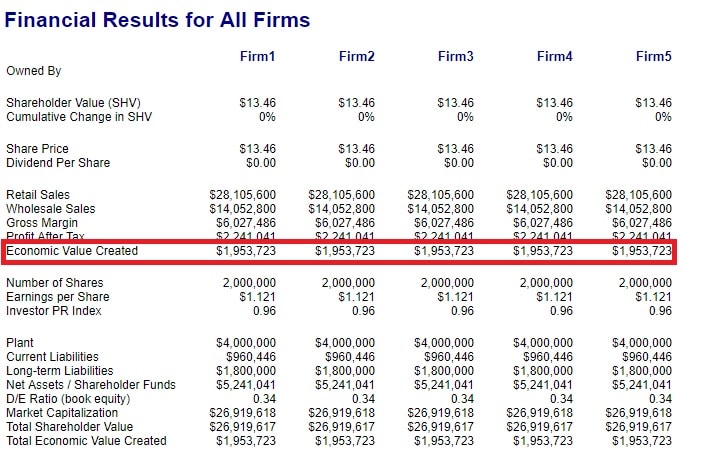
An increasingly popular way of measuring the financial performance of a firm is by looking at the Economic Value Created (often called EVA*) over a specified time span. See the Financial Reports section of the All Reports Menu for the firm’s current Economic Value Created report.

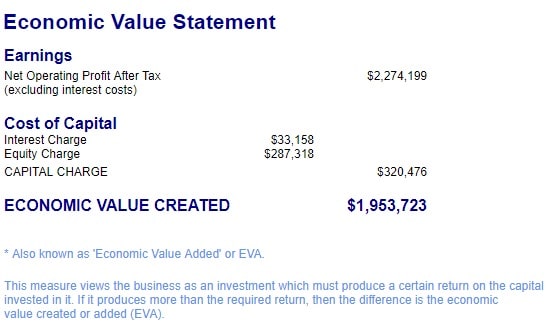
In essence, this measure views the business as an investment which must produce a certain return on the capital invested in it. If it produces more than the required return, then the difference is the economic value created or added (EVA).

The “actual return” is calculated by adjusting the net operating profit after tax to exclude the effects of interest.

The “required return” (or cost of capital) is calculated by adding together the interest charges on debt with the return required by the shareholders. The return required by the shareholders will vary according your firm’s level of risk and will be composed of required dividends and/or increases in share price.

If the actual return is higher than the cost of capital, then the difference is the economic value created. From an economic viewpoint this extra return must be due to some competitive advantage. The question is: How long can this competitive advantage be maintained before competitors come along and copy it?

An example of a simple EVA report is below:

EVA Report in MikesBikes

Notes:

*EVA is a registered Trademark of Stern, Stewart & Co.

Factory to demonstrate Wastage in MikesBikes

Question of the Week: How do we decrease our factory’s Wastage?

Factory Capacity table and chart in MikesBikes

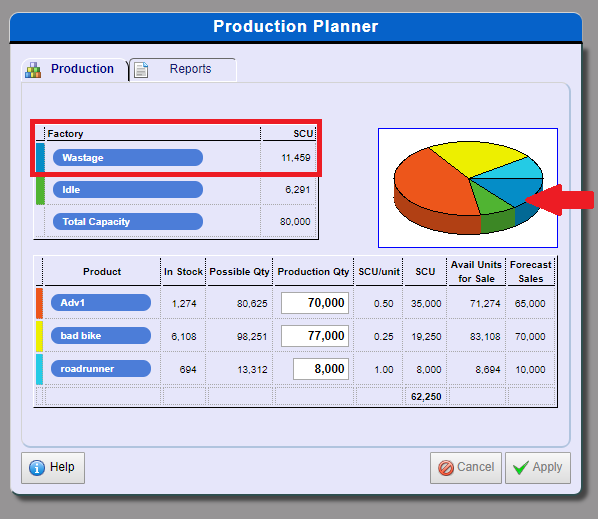
In MikesBikes Introduction, effective capacity will prove to be less than your plan capacity because of various Wastage factors such as:

  • Rework
  • Setup Time
  • Raw Materials Stockout
  • Machine Downtime

Wastage reduces your factory’s efficiency by using up time that could have been utilized to produce bikes. To improve or decrease Wastage, you will need to spend or economically increase your expenditure on Efficiency.

However, there are trade-offs on this. At a certain point, it can get more expensive to maintain a high factory Efficiency. So you will need to decide if it would be more economical to invest in expanding your factory (which can also be quite expensive and its value also depreciates over time) or you can choose to increase spending in Efficiency, which again gets costly at some point. The key is to find balance in between and see what works best with regards to what your firm is trying to achieve and what you believe to be a worthwhile investment.

As such, there is no “acceptable” percentage of wastage that you should be aiming for, as this is dependent on what your firm believes to be a more economical approach on balancing your factory’s efficiency.

Do you have a question suggestion for our next question of the week? Click here to fill out a form or email it through to help@smartsims.com.